Analysing economic figures and their effects on the markets can be difficult and time-consuming. There are plenty of economic calendars out there, but they all lack one thing: the ability to actually analyse how price reacts to the data.
With TradrLab, that’s now possible, just by chatting with AI. In this short guide, we’ll show you how in 5 simple steps.
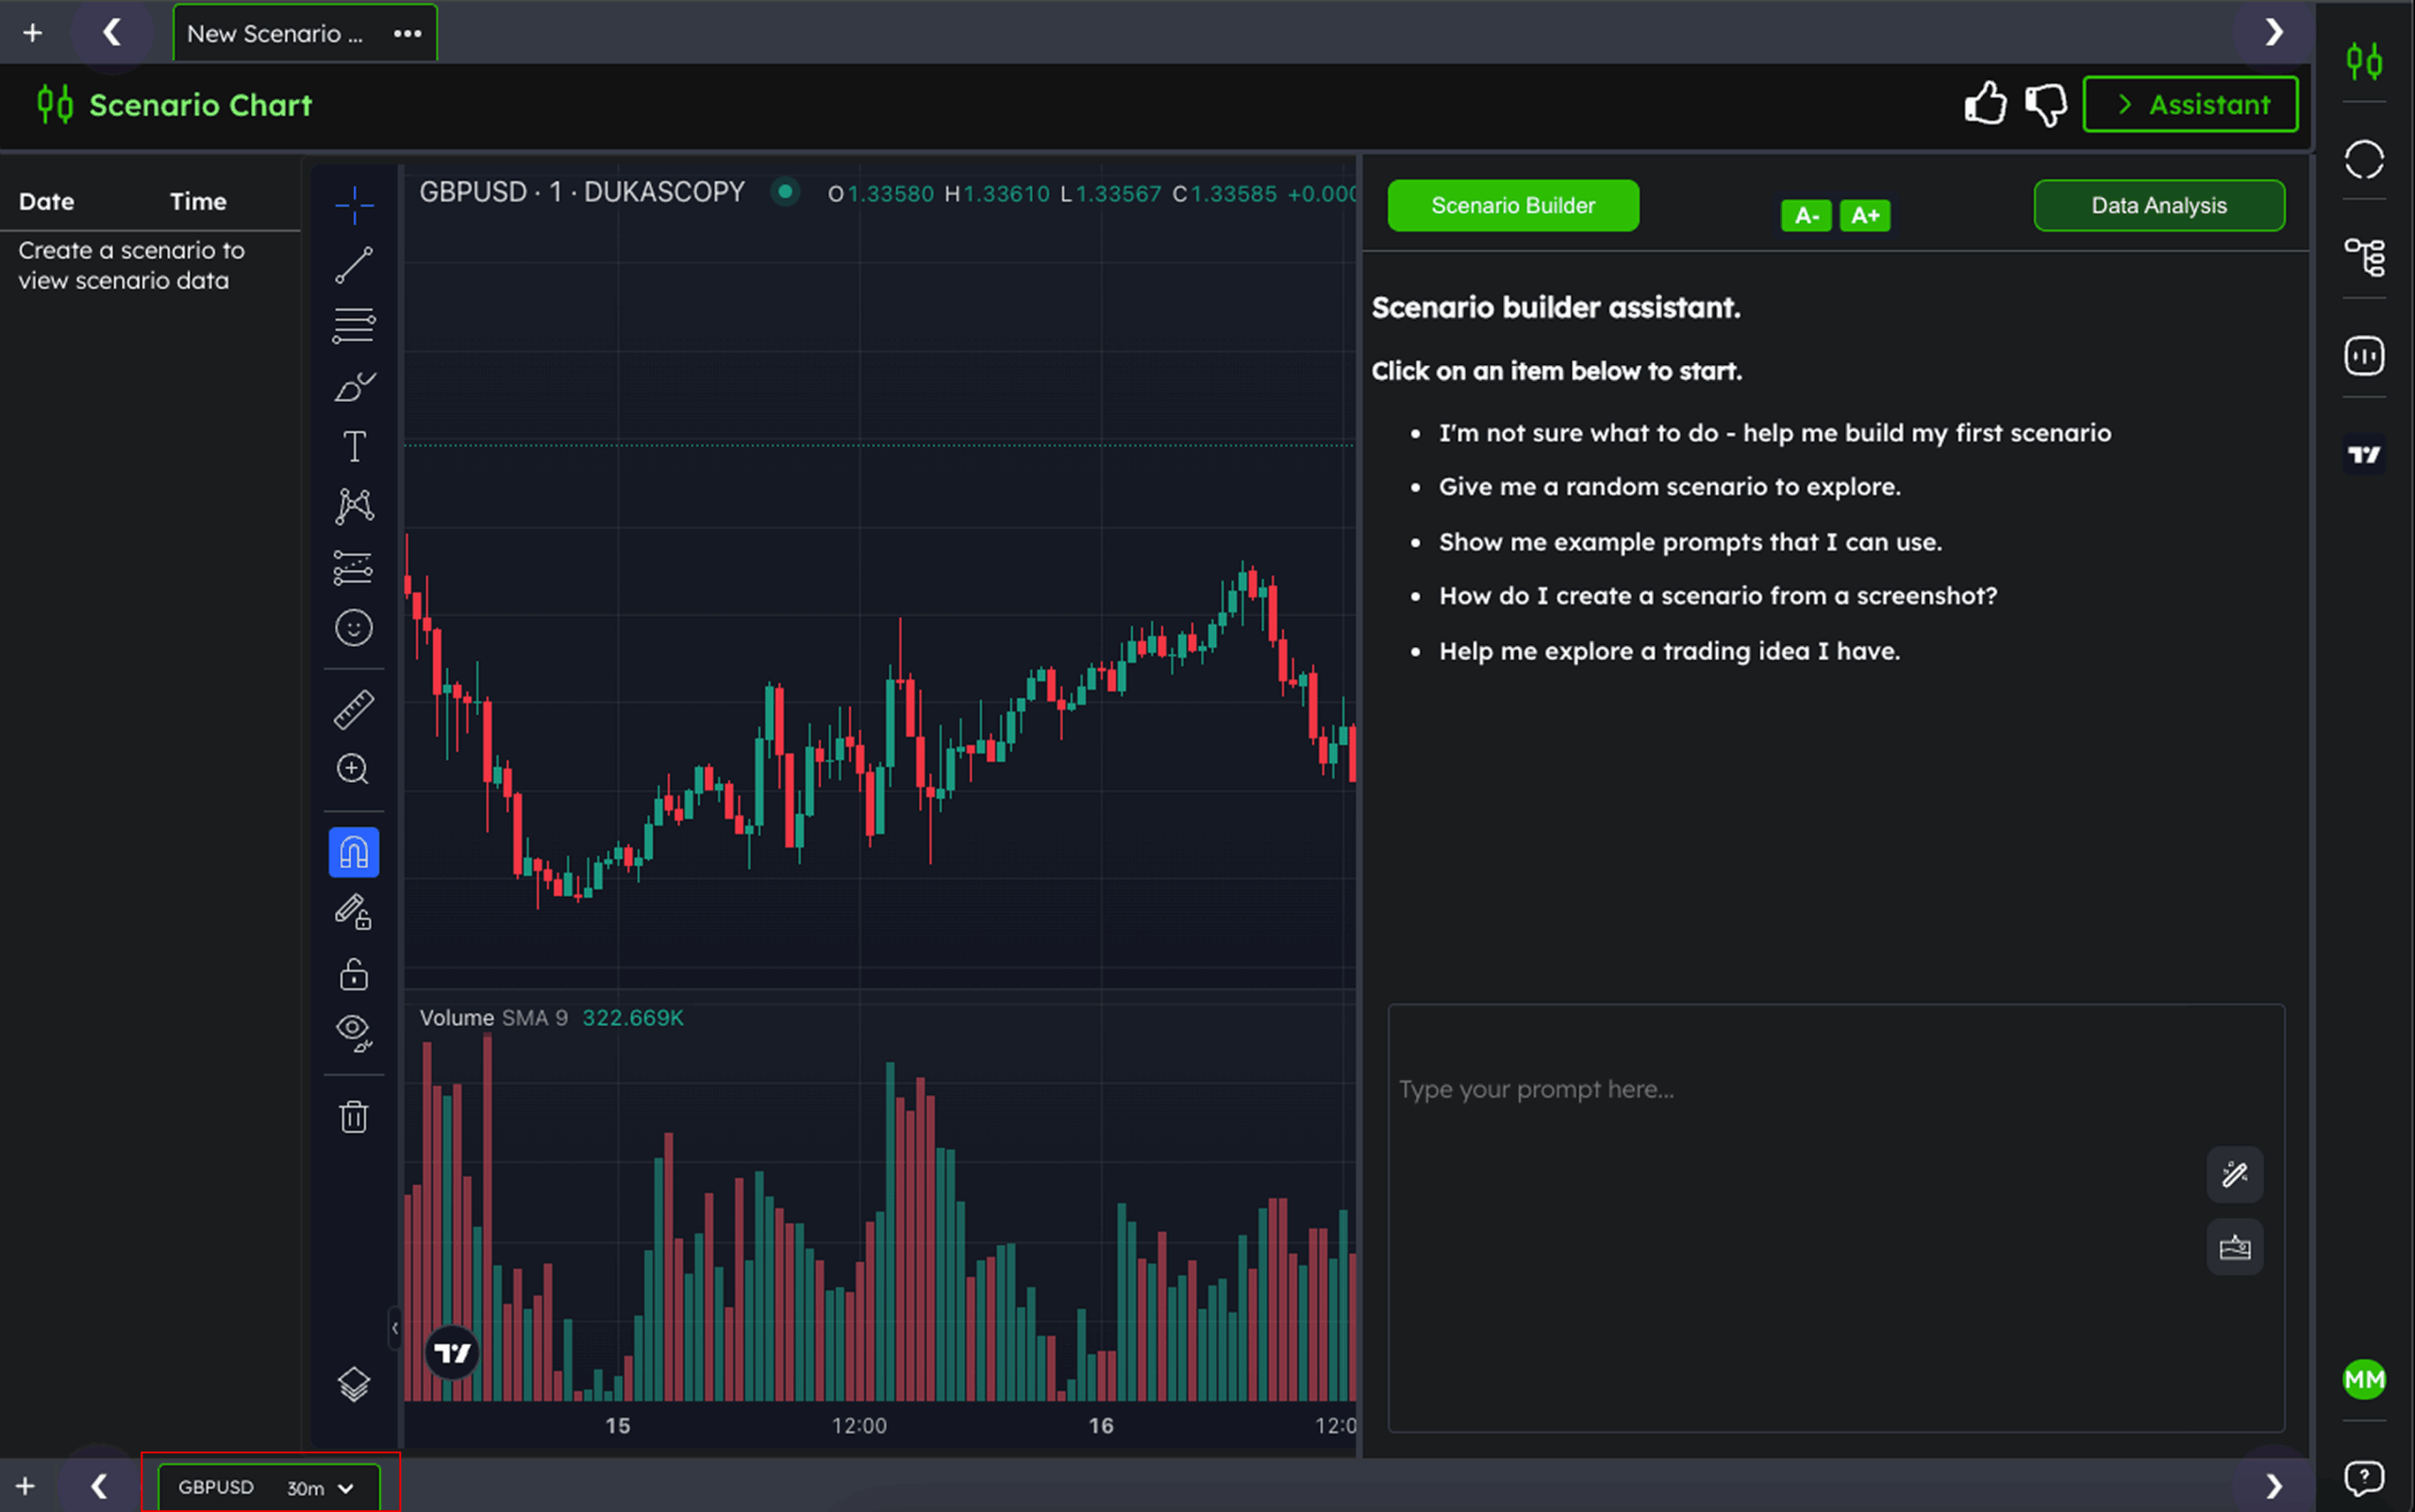
Step 1: Select your symbol and timeframe
In this example, we’re using GBPUSD on a 30-minute timeframe.
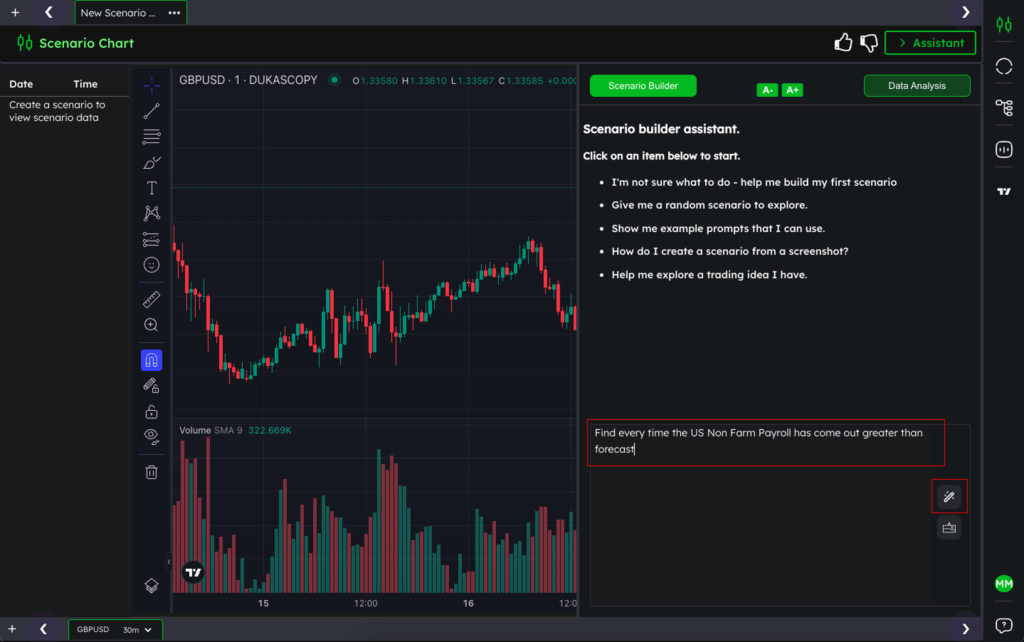
Step 2: Type your prompt
Next, type your prompt to the AI. We’re going to analyse the Non-Farm Payroll (NFP) release, specifically when the actual figure comes out greater than the forecast.
To do that, simply type: Find every time the US Non Farm Payroll has come out greater than forecast
Then click the Send button.
Step 3: Confirm the AI understands and click Generate
Read the AI’s response to make sure it correctly understood your prompt.
This step helps reduce hallucinations and ensures your prompt is accurate.
If everything looks right, hover over the response and click the Generate Scenario button.

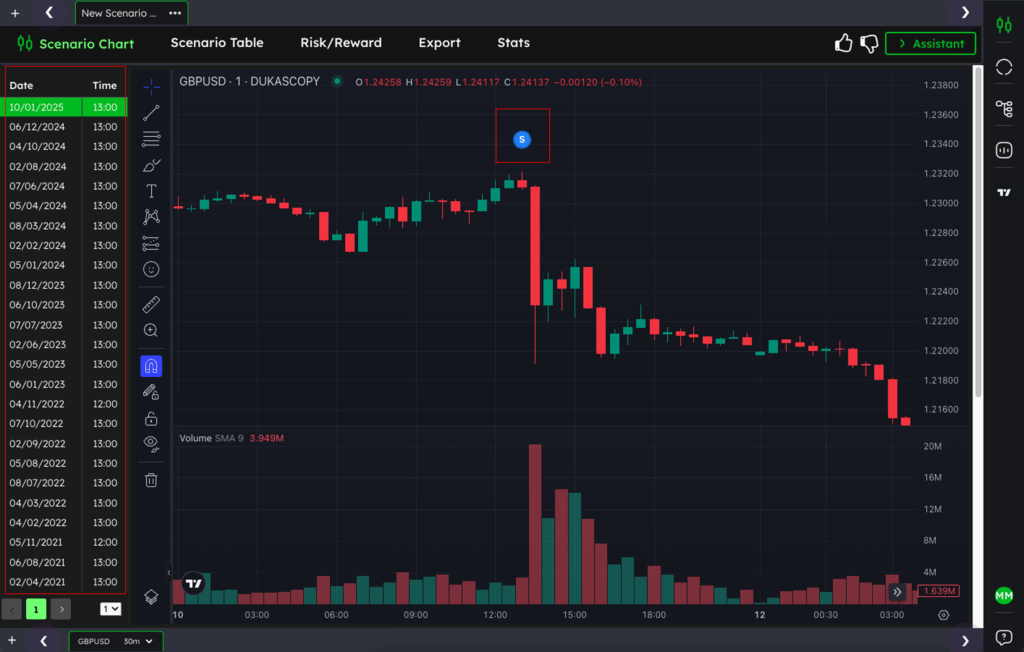
Step 4: Confirm it's built correctly and visually analyse
Once your scenario is built, you’ll see an “S” in a blue circle plotted on the chart—this shows where each scenario occurred.
You’ll also see a list of dates and times on the left-hand side. You can click any of them to jump to that specific moment on the chart.
You could now scroll through and manually review what happened next…
But with TradrLab, you can automate that too, just by chatting with AI.
Step 5: Analyse what happens next
Now that your scenario is built, confirmed, and visually reviewed, it’s time to automate your analysis.
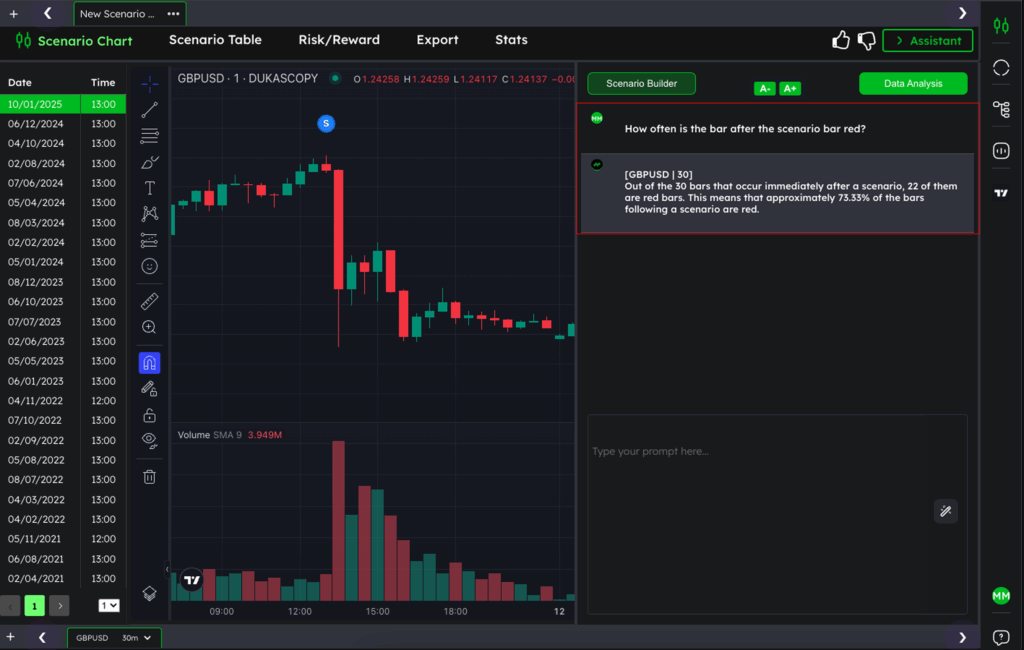
Open the Data Analysis Assistant and ask: How often is the bar after the scenario bar red?
The AI will scan the data, crunch the numbers, and return a result in seconds—saving you hours of manual work.
In this example, roughly 73% of the time, the 30-minute bar following a stronger-than-expected NFP release is red.