Getting started with Tradrlab®

How to Guides - Risk-Reward Matrix

Accessing the Risk-Reward Matrix

To access the Risk-Reward Matrix, click the Risk-Reward button located in the top navigation bar. This will open a blank screen with the Parameters window on the left-hand side.
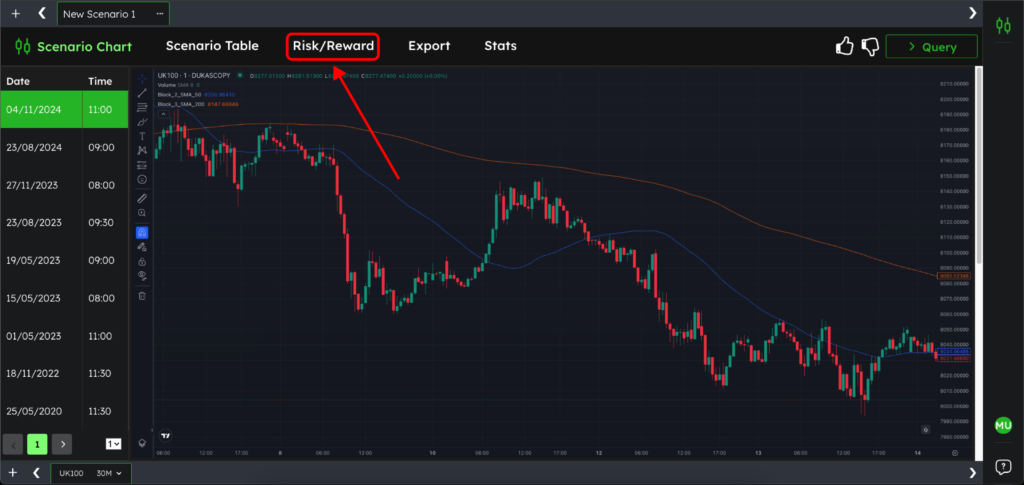
Click Risk Reward

Setting Parameters

To begin using the Risk-Reward Matrix, you need to define several key parameters:

  • Direction: Choose whether you want to analyse potential buy or sell scenarios.
  • Horizon: The Horizon is the time period after the scenario occurs that you want to analyse. By default, this is set to 1 hour, but you can adjust it based on your analysis needs.
  • Minimum Stop Range: This is the smallest stop loss range you want to analyse. By default, it’s set to 2 pips, but you can change it.
  • Maximum Stop Range: This is the largest stop loss range you want to analyse. By default, it’s set to 20 pips, but you can adjust it as needed.
  • Trigger Bar and Trigger Value: This is the bar where you want your Horizon to start after the scenario has occurred. By default, it’s set to Next Close, but you can choose from several options, such as:
    • Next Open
    • Next High
    • Next Low
    • Previous Open, and more.

This allows you to define where to start your analysis based on the scenario bar (the bar with the “S” above it).

Once you’ve set your parameters, click Generate, and the matrix will be created.
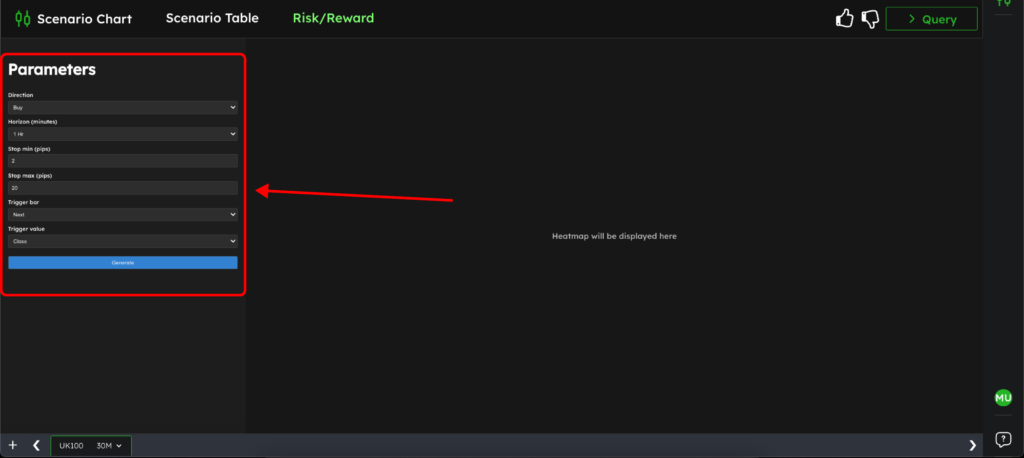
Parameters

Interpreting the Risk-Reward Matrix

Once your matrix is generated, you’ll see a table that shows the potential outcomes based on the parameters you’ve set. Here’s how to read and understand the different elements of the matrix:
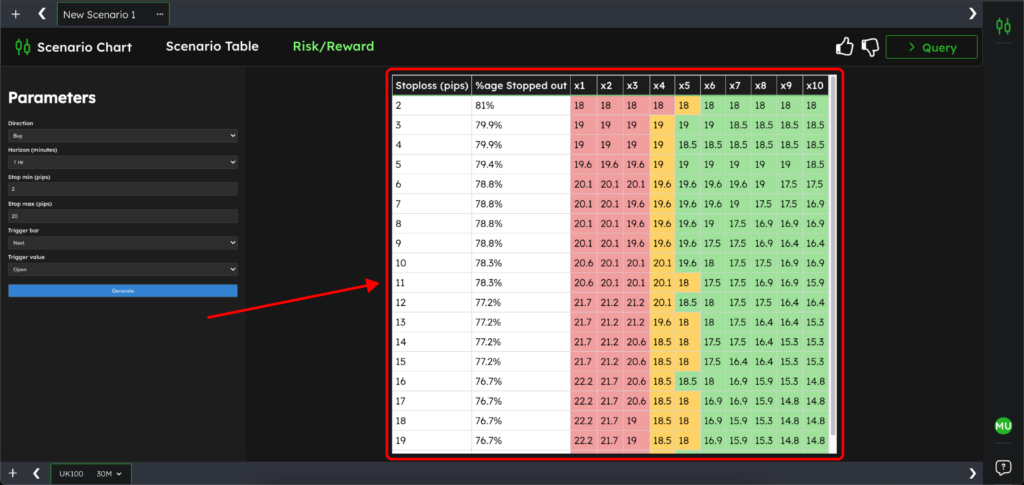
  • Left-Hand Side – Stop Loss in Pips
    This column shows the various stop loss levels you’re analysing, measured in pips. For example, you might see rows for a 5 Pip Stop, a 10 Pip Stop, a 20 Pip Stop, etc.
  • Top Row – X Value
    The top row shows multiples of your stop loss. These multiples represent how many times your stop loss is the size of your target. For example, you’ll see 1x Stop, 2x Stop, 3x Stop, and so on, up to 10x Stop.
    These values represent the potential reward compared to your stop loss. For example, 2x Stop means the target is twice as large as your stop loss.
  • Reading the Values in the Matrix
    Each cell in the matrix will show a percentage value that indicates how often the price reached your target based on your stop loss and the corresponding multiple.
    Example: If you set a 10 Pip stop and a 2x target (i.e., 20 pips), the matrix may show 6% in the corresponding cell. This means that with a 10 Pip stop and a 20 Pip target (2x stop), the price reached the 20 Pip target 6% of the time.
    The values are colour-coded for easier interpretation:
    • Green indicates a higher probability of success.
    • Red indicates a lower probability of success.
    • Yellow indicates a neutral or break-even probability.
Understanding the matrix

Join the TradrLab® newsletter to stay ahead with industry insights, expert tips, and the trading knowledge you need to sharpen your edge.

Think it. Type it. Test it.

Automate your trading analysis without coding