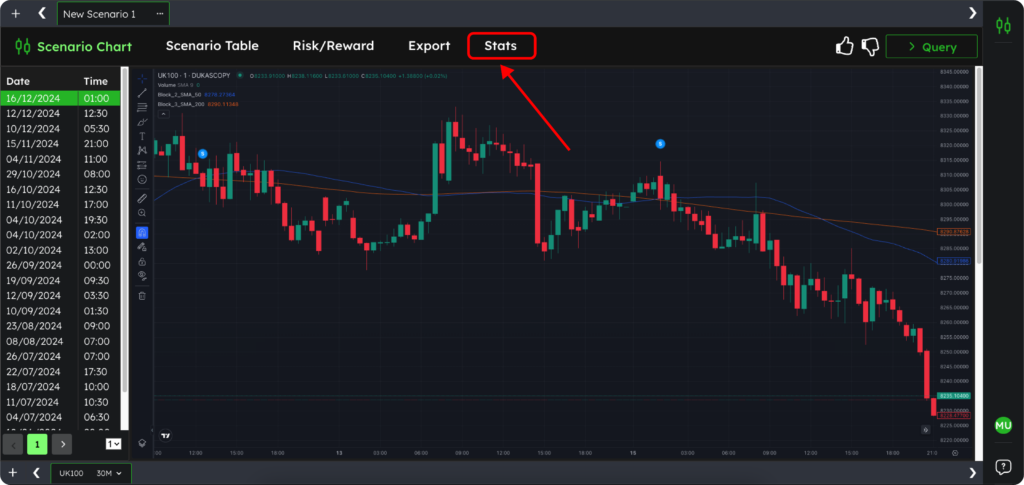
To view the stats for your scenario, click on the Stats button at the top of your screen. Alternatively, scroll to the bottom of the screen using the scroll bar on the right side to find the Stats Panel.
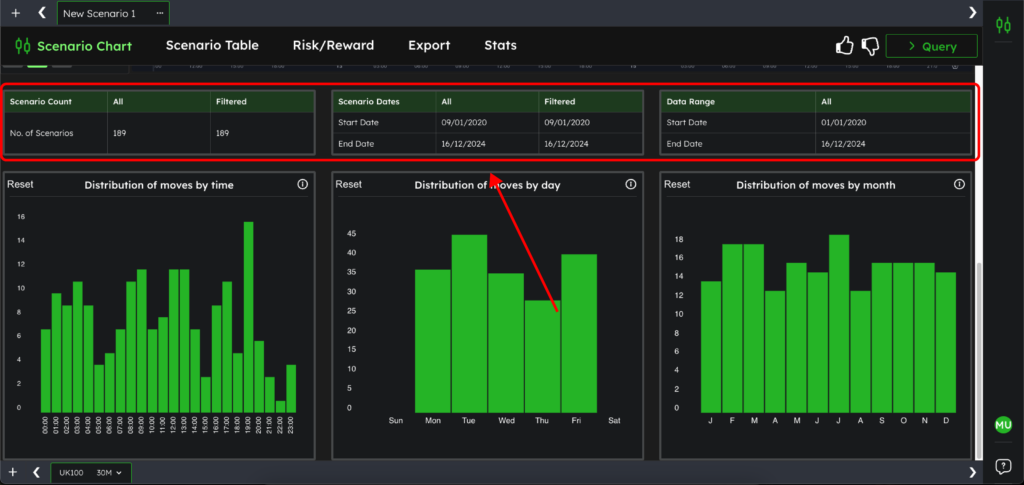
In the Scenario Stats, you’ll find key metrics such as:
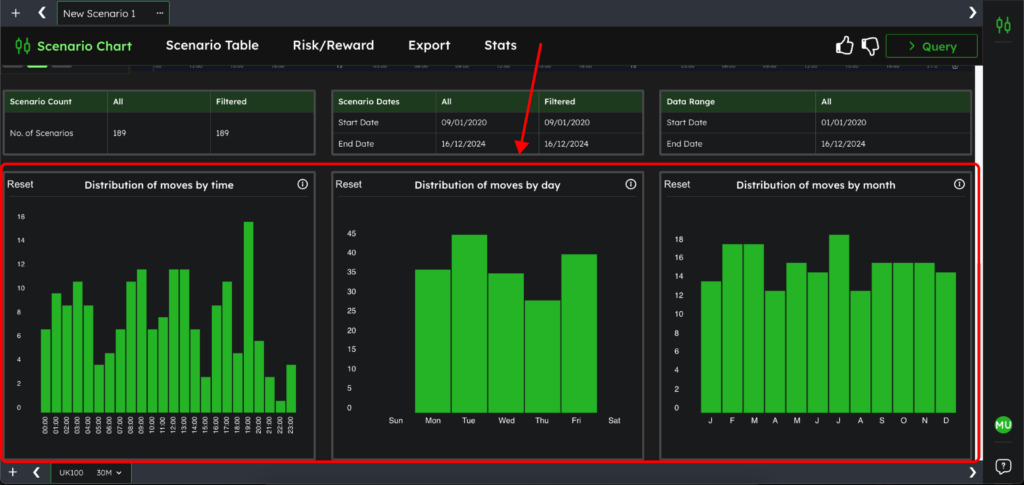
Below the main stats, you’ll find distribution histograms that provide insights into when your scenario occurs:
The histograms are interactive, letting you refine your analysis. Click on any bar to select it, and you can choose multiple bars to filter by specific times, days, or months.
After applying a filter, the Filtered columns in the stats panel will update to show the number of scenarios within the selected data range.
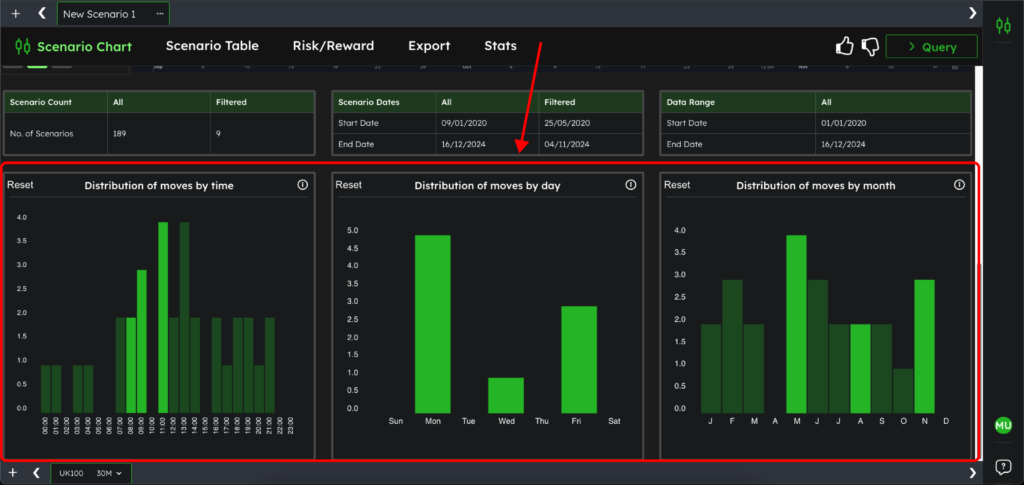
After applying filters, scroll back up to the chart. On the left-hand side, you’ll see the dates and times where your filtered scenarios occurred. These will match the filter conditions you’ve applied, enabling you to focus on the most relevant data for your analysis.
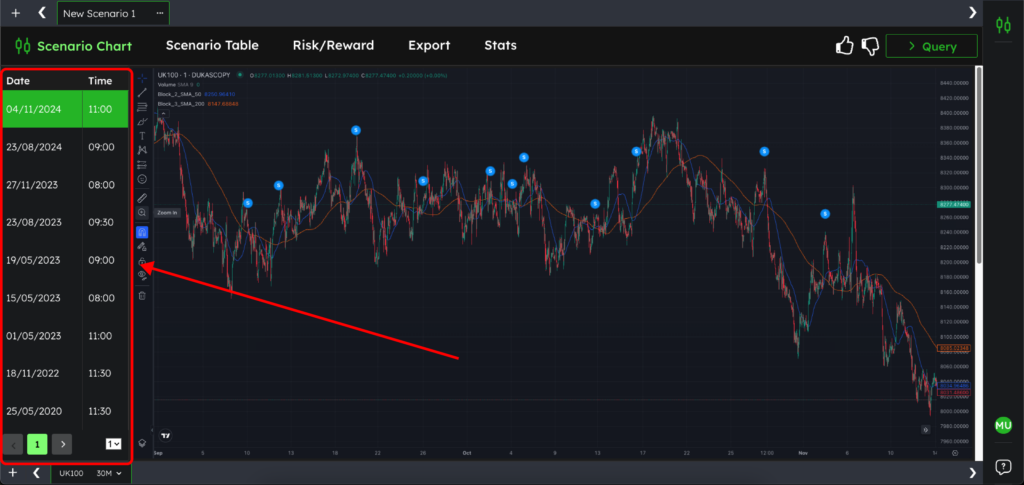
With the Scenario Stats and Crossfiltering tools, you can gain a deeper understanding of how often and when your scenarios occur, refining your analysis to concentrate on the conditions that matter most.
This functionality helps you make more informed decisions based on historical data, leading to better insights and improved trading strategies.
Join the TradrLab® newsletter to stay ahead with industry insights, expert tips, and the trading knowledge you need to sharpen your edge